
At a glance
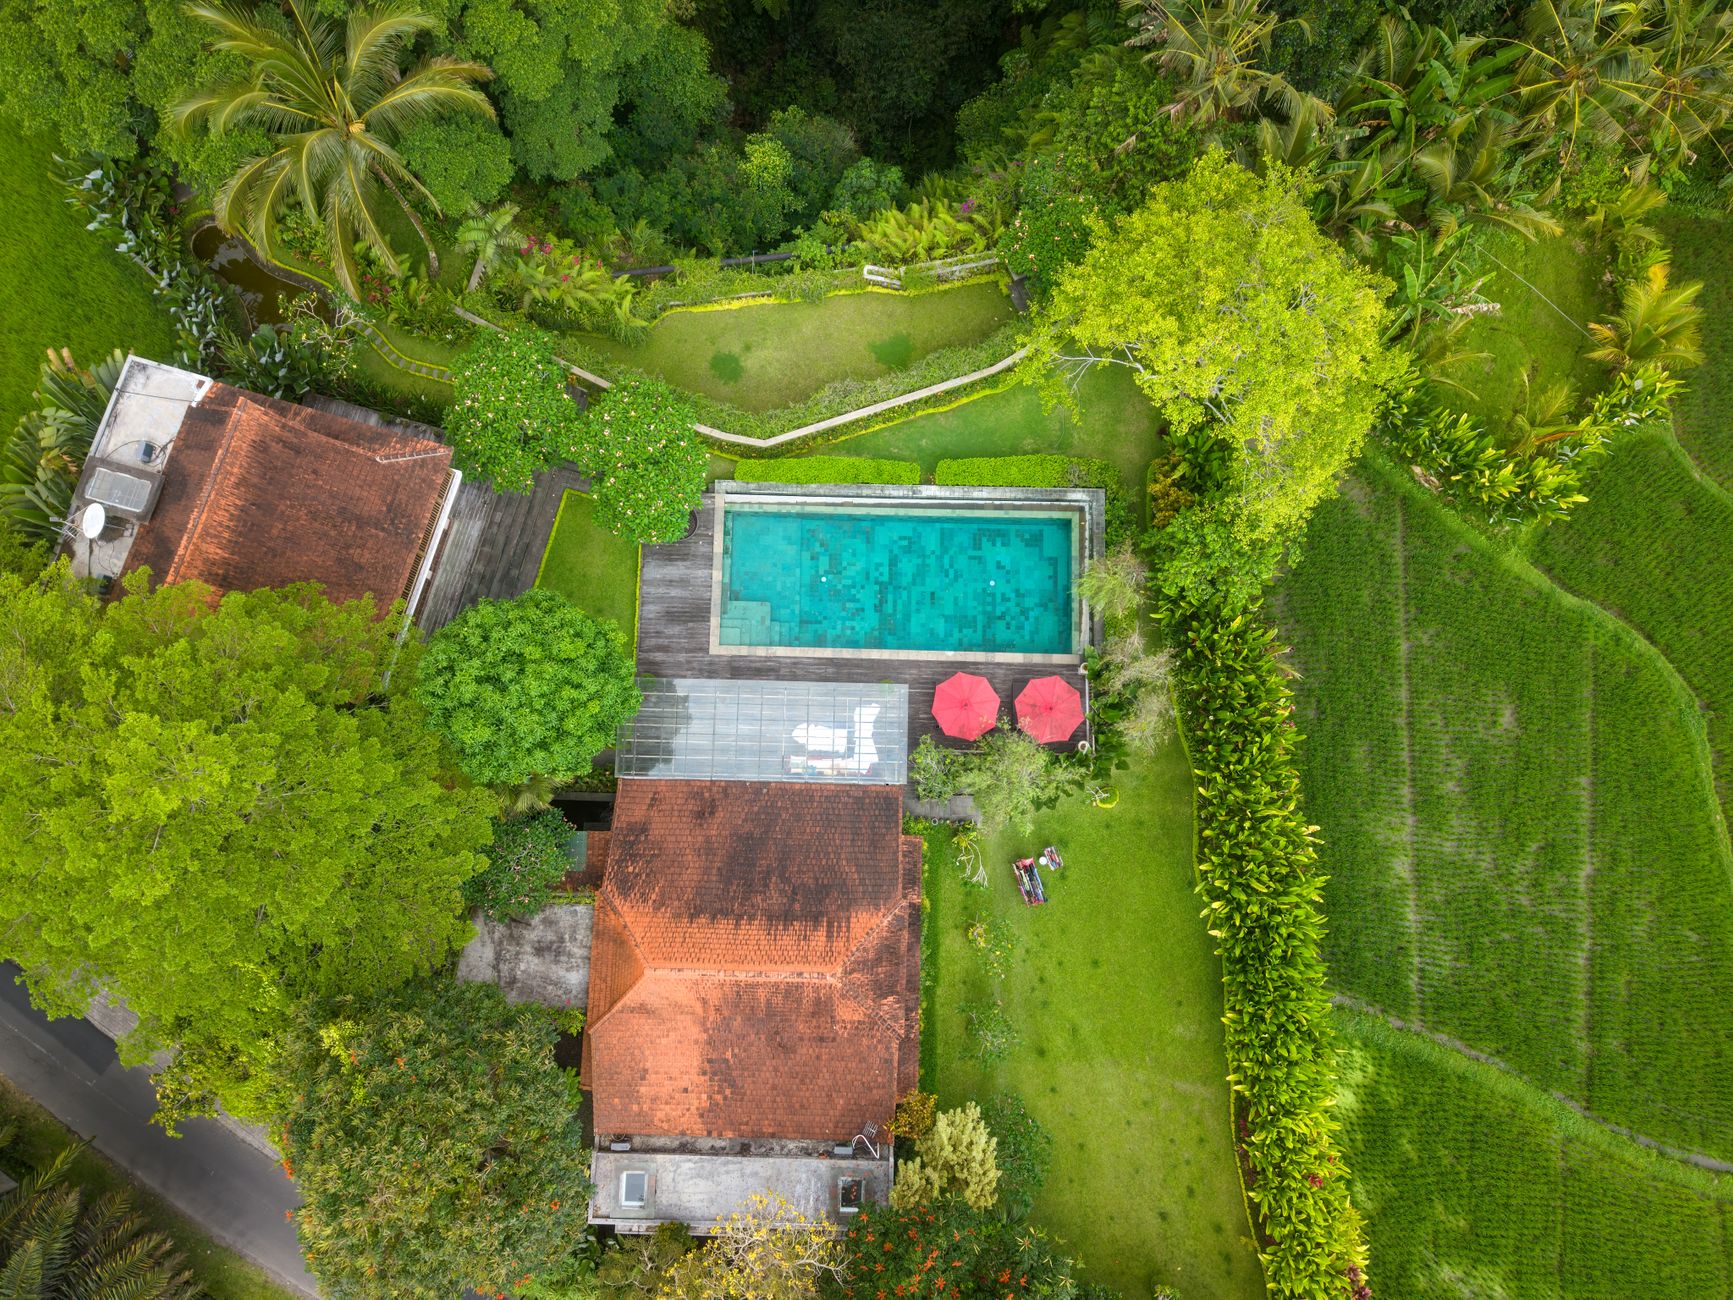
- Client: A foreign-owned boutique villa operator in Bali with private-pool villas live and a second plot under construction
- Sector: Hospitality and villa rentals
- Region: Indonesia (Bali)
- Service: Investor deck and financial modelling
The challenge
The client ran a few private-pool villas in Bali and was finishing a second plot with larger villas, an apartment, an office and a commercial unit. The two plots had different shareholders. They needed one investor deck showing the market, their guests, their competitors and the numbers. They also needed a model to answer practical questions. What would occupancy of 70%, 80% or higher mean for profit and dividends? What would breakfast, airport transfers, scooter hire and massage add? Should the two plots be run as one complex or two businesses?
What we did
- Took a written brief and a round of revision notes from the client covering current rates, the new plot's units and the shareholder structure.
- Built the market section from public data on Bali arrivals, accommodation growth by regency and real estate market size.
- Defined four target guest segments by origin and income band, and mapped competitors by price and USP with a SWOT.
- Built the financial model in IDR with EUR and AUD versions, at 70%, 80% and 90% occupancy, each with base and +10%, +20% and +30% rate scenarios.
- Modelled rooms revenue, OTA commissions, housekeeping costs, staffing, capex, opex, depreciation and tax over 8 years.
- Added ancillary revenue lines (shop, scooter rental, airport pick-up, massage, breakfast, laundry), with prices taken from competitor research as the brief asked.
- Compared running the two plots separately vs as one complex: cash flows, present value, dividends per shareholder and an EBITDA-multiple valuation.
- Produced versions with 0% and 10% of earnings retained.
Topics covered
- Bali tourism and accommodation supply
- Target guest segments by origin and income
- Design trends: biophilic, modern-traditional, sustainable
- Competitor positioning and SWOT
- Occupancy and rate scenarios
- Ancillary revenue streams
- Shareholder returns and company valuation
What we delivered
We delivered a final investor deck (PowerPoint and PDF). It covered the company overview, Bali market analysis, target guests, design trends, competitors, SWOT, pricing, marketing channels, financial projections and expansion plans. We also delivered final Excel financial models at 70%, 80% and 90% occupancy, each in IDR, EUR and AUD, plus variants with 0% and 10% retained earnings. The calculations and valuations we provided were the basis on which the owners went on to sell shares in the company.
Investor deck
PowerPoint and PDF · approx. 30 slides
- Company and product overview
- Bali market: arrivals, accommodation growth, property trends
- Four target guest segments
- Design trends
- Competitor map and SWOT
- Pricing, channels, projections and expansion plan
Financial model
Excel (IDR, EUR, AUD) · 3 occupancy versions plus retained-earnings variants
- Settings: occupancy, FX rates, service prices, shareholdings
- Revenue streams, commissions and cost of sales
- Ancillary services revenue
- Staffing, capex and opex
- 8-year P&L, cash flow and present value
- Dividends per shareholder and EBITDA-multiple valuation
- Combined vs separate plot scenarios
What we found
- Outcome: our profit projections, dividend calculations and EBITDA-multiple valuation gave the owners the numbers they used to sell shares in the company.
- Bali's accommodation supply grew from 4,143 establishments in 2018 to 6,426 in 2023, with the largest increases in Denpasar, Badung and Gianyar. A new entrant needs a clear position.
- We set four guest segments for the deck: affluent Europeans, high-income Asia-Pacific travellers outside ASEAN, mid-range American travellers and ASEAN short-break guests, each with an income band.
- The model let the owners compare running both plots as one complex with keeping them separate, before they put either option to shareholders.
In numbers
- Accommodation establishments in Bali's regencies: 4,143 (2018) to 6,426 (2023), as cited in the deck
Key takeaway
Investors buy into numbers they can test. A model that shows occupancy, rate and structure scenarios side by side turns a villa business into something a buyer can value.